Introduction to the AWS WAF Traffic Overview Dashboard
Published Date: July 2, 2026
Hello everyone. Today, I want to share a highly useful update that makes monitoring web application security much easier: the AWS WAF Traffic Overview Dashboard.
For security and operations teams, maintaining application uptime requires continuous monitoring of baseline web traffic and rapid investigation of suspicious IPs. The main challenge is scaling application delivery without needing to inflate the size of your Security Operations Center (SOC) team. To address this pain point, AWS WAF introduced a built-in traffic overview dashboard that enables quick and accurate decision-making.
What Makes This Dashboard Special?
The best part is that it is completely free and available by default, requiring no additional setup.
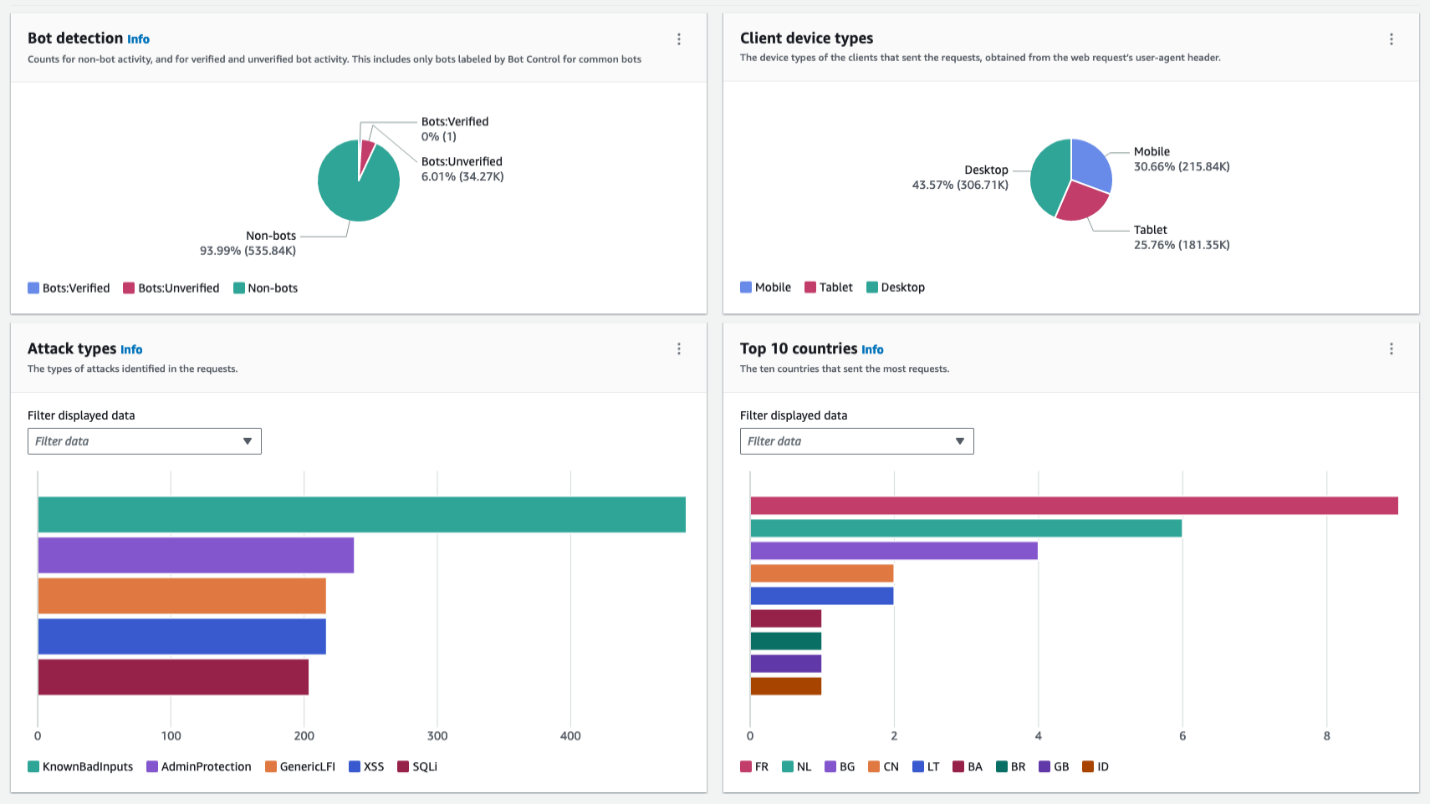
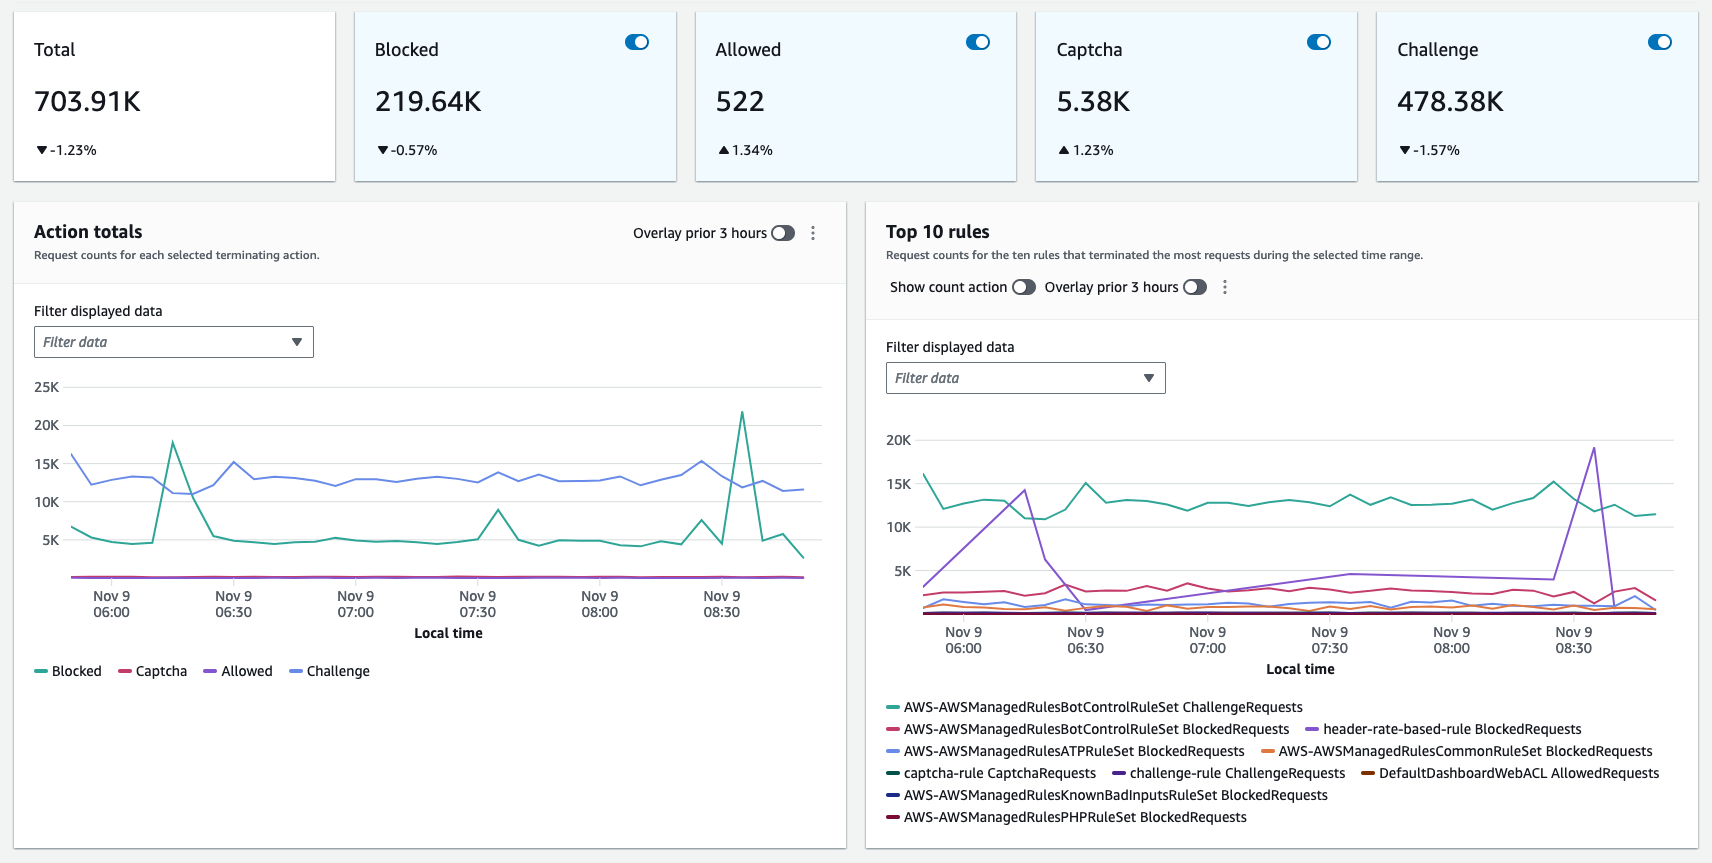
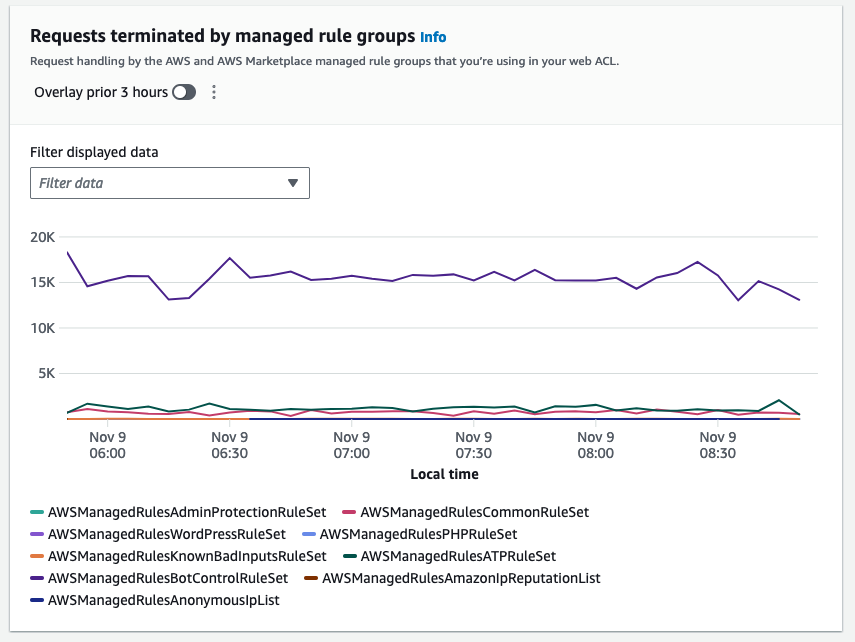
The dashboard provides a near real-time view of CloudWatch metrics collected by AWS WAF. You can monitor:
- Total requests, allowed vs. blocked requests.
- Bot vs. non-bot traffic comparisons.
- The top 10 active rules triggering blocks.
- A dedicated “Sampled Requests” tab, displaying the last 100 requests matching specific rules and 100 requests matching default actions within the last 3 hours.
It categorizes requests with detailed analysis by attack type, device type, and country of origin. For example, if your app is designed only for desktop users in Vietnam but you see a sudden spike in mobile traffic from France, you can immediately identify the anomaly and take action.
Practical Use Cases: Pattern Analysis and System Troubleshooting
Beyond just visual appeal, this dashboard helps you hunt down traffic spikes and anomalous patterns. If your baseline is normally 2,000 requests/minute and it suddenly shoots up to 10,000 requests/minute with unexpected device headers, it’s a clear signal to investigate.
If a specific WAF rule is blocking a massive amount of traffic, the dashboard immediately highlights the vector, showing you exactly what exploit attempt is targeting your origin.
Next Steps After Analysis:
- Fine-tune WAF rules: Adjust regex rules to eliminate false positives or prevent bypasses.
- Enforce Rate Limiting: Apply rate-based rules to protect database-heavy endpoints.
- Facebook Post Link: AWS Study Group VN
- Original Article Link: Introducing the AWS WAF Traffic Overview Dashboard…